Technology
The ViPA, Visual Process Analyser, is an on-line instrument that can be used for the monitoring of particle, droplet sizes and concentrations. The ViPA can operate continuously on-line at high pressure and elevated temperatures. The materials that the ViPA is constructed from, namely 316 stainless Steel and industrial sapphire, ensure that continuous and reliable operation is maintained in a wide variety of inhospitable environments. The ViPA can analyse any optically transparent fluid.
How It Works
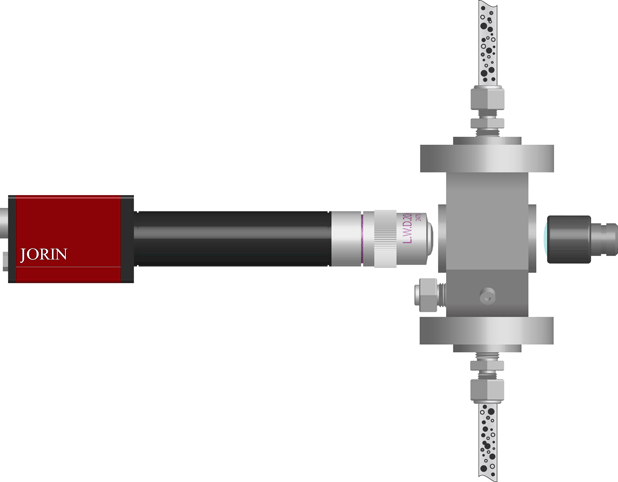
The ViPA uses a video microscope in a rugged assembly consisting of a video camera and lens and a light source to examine the contents of a liquid, contained in the measuring head. Sample fluid flows through the ViPA’s cell module, which has a pair of transparent windows, and the camera looks through the water at the light
source. This provides the video microscope with a backlit view of the objects in the water flow, whether these are solid particles, liquid droplets or gas bubbles.
The ViPA operates by freezing a single frame of the video image and analysing the objects present. A database of information is built by rapidly acquiring and analysing sequences of these frozen images. Using image analysis techniques to differentiate between particles, droplets and gas bubbles the ViPA monitors, and records data on, up to seventeen parameters about each particle and droplet continuously in real time which include size (microns) and concentration (ppm).

Typical parameters include Feret diameters, perimeter, size, aspect ratio, shape factor and optical density. These measurements can be used to create a mathematical description of a particle size for real‐time particle identification. Size distributions and volumetric concentrations are generated for each particle type assessed. For example, quartz sand has high aspect ratios, medium shape factors, low optical density and these parameters can be used to differentiate between quartz sand and silt.
ViPA Software
The ViPA produces many different types of data for each particle observed, the most commonly used data are particle or droplet sizes and concentration information. The video shows what the ViPA software looks like when it is running; in this setup it is left to run continuously plotting data points once every minute. The particle size distribution for solid particles and the particle size distribution for droplets are each plotted separately; further statistical information and the concentration data are also saved on the computer system to allow analysis and data presentation when the run has concluded.
When operating in continuous online mode then the ViPA analyser will provide data updates as frequently as every 10 seconds. Typical data outputs are droplet concentration and solids concentration in the top graph, and droplet size and solid particle size in the bottom graph. This allows process condition and fluctuations to be monitored and the ViPA software can also use trend analysis to monitor for future process upsets. All the data provided in graphs, along with many analyser alarms can be provided as serial data over Modbus or through 4‐20mA outputs and volt free contacts.